Why Monitoring Your Application is Important?
DataProt is supported by its audience. When you buy through links on our site, we may earn a commission. This, however, does not influence the evaluations in our reviews. Learn More.
Ideally, apps should load within 2 seconds. 70% of mobile app users leave apps that take longer than that. This is why most app developers value application monitoring.
The app monitoring process offers unified tracking, analytics, and surveillance of an app’s performance. It helps locate and fix bugs and other issues to improve user experience.
Continue reading to know why application monitoring is important and see the best tools you can use.
🔑 Key Takeaways
- Application monitoring helps prevent system outages by providing data on CPU, network traffic, and responses.
- The process aids in addressing issues in complex systems like ERP by identifying problems in various layers and dependencies.
- It also promptly points out security issues, reducing the risk of cyberattacks and addressing vulnerabilities.
- Monitoring optimizes resource usage, leading to faster application performance and a better user experience.
- Tools like Datadog APM and Site24x7 automate app monitoring, making it easier to formulate insights.
Reasons Why Application Monitoring is Important
Application monitoring is a fundamental process since it helps detect critical problems and performance issues. It lets you develop a solution before anything affects your app operations.
To put it simply, application monitoring ensures your system works well. Here are some reasons why this process is important:
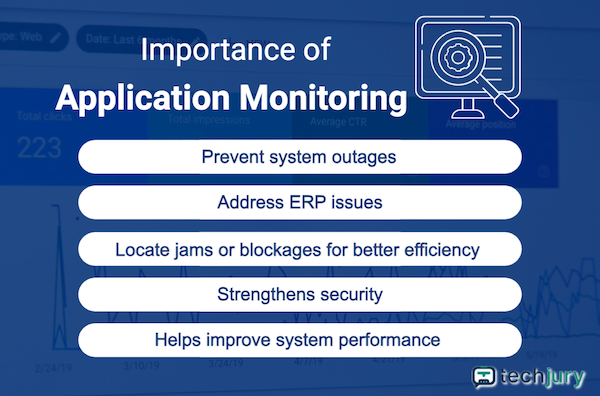
Prevent System Outages
Application monitoring shows your system’s performance. This information includes CPU usage, network traffic, application responses, etc.
The insights from this process can notify you when to have downtime to prevent an outage.
You can find issues like slow responses or errors with real-user monitoring. This way, you can know the problem before affecting end users.
Address ERP Issues
Enterprise Resource Planning (ERP) is a complex system with many layers. Check out the video below to get a basic idea of how ERP works.
An issue with a single layer in ERP can affect the rest. With application monitoring, you can see the entire system and check particular layers with problems.
Besides ERP, you can also check on application dependencies using this process.
Locate Blockages for Better Efficiency
Application monitoring shows the entire performance of your applications. It can find jams or blockages with tracing, metrics, tracking, and more to improve your system’s efficiency.
Strengthens Your Security
Every system is always prone to cyberattacks. These attacks usually happen when you have unresolved security issues.
However, if addressed on time, you can avoid those problems. With application monitoring, you can detect any security issues and address them right away.
Helps Improve System Performance
Application monitoring will help you prevent your app users from turning to another. With this process, you can check your CPU, disk space, bandwidth, etc.
As a result, you can find any issue that slows your application down. Fixing these issues on time can lead to fast performance and better user experience.
Understanding App Monitoring and How It Works
App monitoring provides insights into your application’s availability, end-user experience, and overall system performance. It ensures that your app works fast, efficiently, and error-free.
Real-time input-output data is necessary for application monitoring. This data is gathered from transmission and undergoes analysis and correlation.
To automate the process, app monitoring tools are employed. These tools generate reports that IT experts and app developers use.
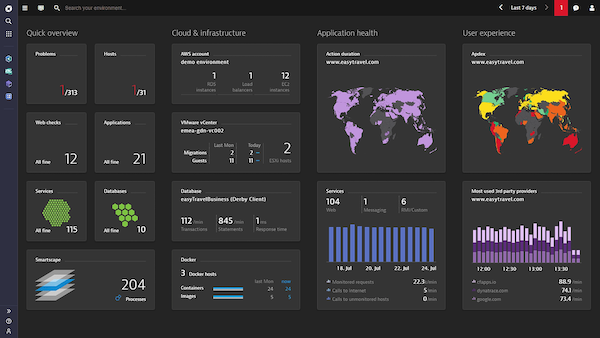
Most app monitoring tools have a dashboard with data and stats on your app performance. It shows response time, errors, and throughput. The tools also display event logs that you can use to fix bugs in codes or queries.
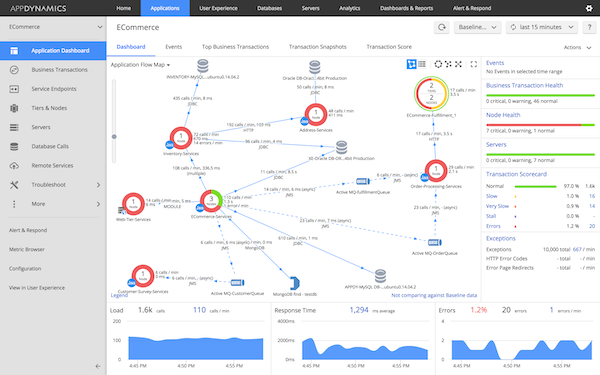
As an example of how app monitoring tools work, take a look at Cisco’s AppDynamics processing:
Best App Performance Monitoring Systems
Below are five of the best app performance monitoring systems you can use:
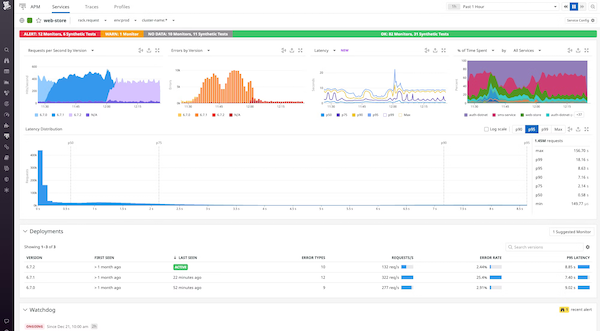
Datadog APM
Key Features
- Code-level distributed tracing for finding issues
- All telemetry in context to improve performance
- Automated deployment tracking
- Watchdog AI for fixing incidents faster
- Datadog and OpenTelemetry for getting data
Pricing: Starts at $31 per month
Datadog APM is an efficient APM tool that can easily detect application bugs or issues. It works as a cloud-based system with a fast process to see any problem within seconds.
This tool offers real-time monitoring of apps, infrastructure, and event logs. It also works with hybrid, cloud-based, and on-premises system types.
| Datadog | |
| Pros | Cons |
| Fast bug or issue discovery | Needs more documentation in some aspects |
| Real-time app performance monitoring | Needs improvement in managing resources |
| Support for different systems | Navigation can be complex for some |
| Control over cost and retention through distributed tracking | |
| Real-time performance issue notification | |
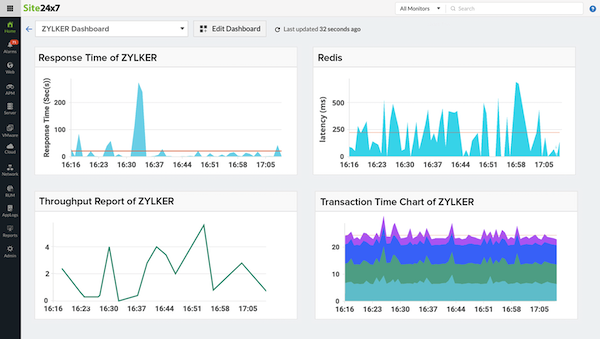
Site24x7
Key Features
- Distributed tracing to improve user experience
- App topology visualization for better contextual debugging
- Custom component monitoring for getting key metrics
- AI-powered alerting and reporting for anomaly detection and error troubleshooting
- Comprehensive and real-time viewing
Pricing: Starts at $35 per month
Site24x7 is another excellent APM tool that can work on several platforms like PHP, Node, Ruby, NET, and Java.
With this tool, you can check all applications running on cloud and mobile devices. You can also get insights into your app activities.
| Site24x7 | |
| Pros | Cons |
| Performance monitoring compatibility with several platforms | Understanding the entire set of functions can take time |
| Continuous application tracking on mobile and cloud | Complex interface navigation for some users |
| Individual transaction tracking through an entire architecture | |
| Quick identification and troubleshooting | |
| AI-powered alert option for better user experience | |
AppDynamics
Key Features
- Allows connection of business results to IT teams
- Cognition Engine with machine learning for real-time anomaly and bug fixing
- Hybrid environment management through hybrid cloud monitoring
Pricing: Starts at $60 per month
AppDynamics is an APM tool trusted by many users. It lets you see the entire application infrastructure to check for issues that affect user experience.
This tool is also best for apps dealing with high traffic. It has database monitoring that can keep track of high-volume production.
| AppDynamics | |
| Pros | Cons |
| Efficient application infrastructure visualization for issue detection | Complicated troubleshooting for network systems |
| Improves user’s digital experience through a fast bug-fixing process | Complex data configuration when visuals get lost |
| Compatible with cloud-based and on-premises applications | |
| JMX monitoring and controlling support | |
| JVM dependency mapping | |
| Detailed environment testing and development | |
Dynatrace
Key Features
- Full-stack monitoring with various techs for transactions and separate tools for components
- Combines real-user and synthetic transaction checking with session replay for a full view
- Offers code-level observability to support cloud-based, on-premise, or hybrid apps monitoring
- Automated infrastructure and cloud platform monitoring
- Stack component monitoring, mapping, and discovering
Pricing: Starts at $0.08 per hour (Less than $60 per month)
Dynatrace is an APM tool that most DevOps teams use. This tool allows you to see the performance of an application from various angles.
Another thing worth noting is that Dynatrace offers a customizable user dashboard, making it easy to check app performance based on preference.
| Dynatrace | |
| Pros | Cons |
| Network and app monitoring from any location | Improvements are necessary for documentation |
| Customizable dashboard for real-time status | Needs better illustration on the displayed graphs |
| App behavior, metrics, logs, and vulnerability monitoring | |
| Workload monitoring for everything inside Dynatrace containers | |
| Real-time bug and issue diagnosis and troubleshooting | |
AppOptics APM
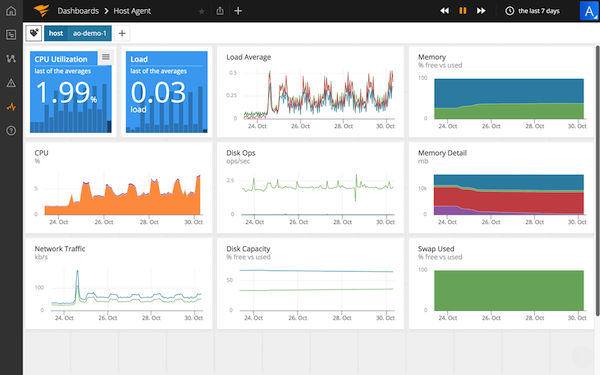
Key Features
- Offers a topology map for auto-instrumented app service
- Performance issue detection
- Real-time application performance monitoring
- Full-stack viewing for diagnosis
- Modern infrastructure and AWS monitoring
Pricing: Starts at $9.99 per month
AppOptics APM is an APM tool under SolarWinds that many companies use. This tool is famous for being an affordable option for app scaling.
This tool is often used for resource usage tracking. It’s a crowd-favorite option due to its compatibility with languages like Node, Python, Java, and NET.
| AppOptics APM | |
| Pros | Cons |
| Critical system tracking and continuous health status updating | Not compatible with Oracle, ServiceNow, and GCP |
| In-depth analysis for a faster bug or issue diagnostics | Poor alerting functions and downstream service checking |
| Request tracing using high-tech filters and insights | |
| Uses automated instrumentation | |
| Request latency checking through heat map support | |
Conclusion
Application monitoring plays a crucial role in your business. With APM, you can detect issues or bugs and fix them before they even affect your operations. It also helps you improve security and user experience.
To make app monitoring easier, get an APM tool. The app monitoring tools listed above have features guaranteed to improve efficiency and security. Select the one that best fits your needs and budget.